
Inside the Budget Part 6: The School Budget – Funding Sources
Today we are going to take our first look at the school budget. This post will discuss the sources of funding, and in future posts, we will go into more detail about its various aspects.
Let’s start with a pie chart of FY 2019 revenues:
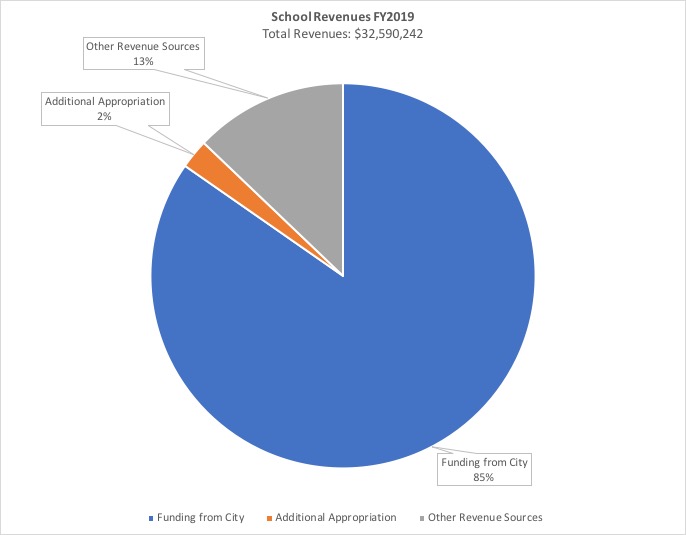
The biggest slice, $27,596,824, is the amount appropriated in the city’s FY 2019 general operating budget. Remember that although we often talk about “the school budget” and “the city budget” as if they were two different things, the School Department is just one department in the city, along with the Police Department, DPW, etc., so the school budget is actually part of the city budget.
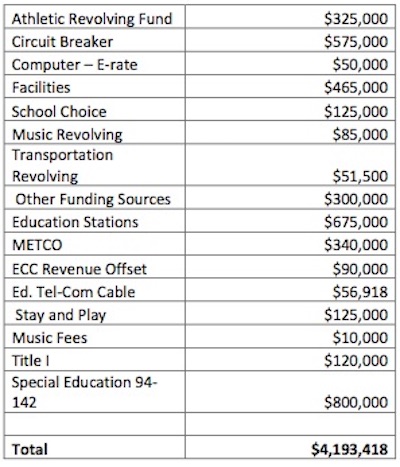
The next slice, $4,193,418, “other revenue sources” is the anticipated funding from state and federal sources such as Title I and special education grants and funds, including circuit breaker (state reimbursement for some special education expenses), as well as student fees for athletics, music, and other activities. Some of these funds come with restrictions on how the money can be spent. For example, money from the athletic revolving fund can only be used to support athletics. Here’s the list:
Finally we have an additional appropriation of $800,000. This comes from what is called “free cash,” which is the amount left over at the end of the previous year’s financial activities (free cash applied to the FY 2019 budget comes from FY 2018). The city is conservative in its estimate of revenues and monitors both closely in an effort to have a positive balance at the end of the year. This money becomes available to us once the books are closed for the fiscal year, so although the FY 2019 budget was finalized in June, this appropriation will be made in the fall, after our FY2018 free cash is certified by the state. However, it is not a reliable funding source. There have been years where the free cash was zero or even a negative number.
Each year the Board of Aldermen can appropriate some of this “free cash” for different purposes. The best practice is to use it for one-time expenses, such as repairing a roof, rather than ongoing expenses such as the school budget. However, the amount of money it takes to run schools at a consistent level is less than the amount we have available to appropriate from tax revenues and state aid at the beginning of the fiscal year.
So looking back at our pie chart, 87% of school funding comes from the “city budget”—local tax revenues and state aid. This means that the limits of Proposition 2 1/2 have a direct effect on the schools.
The current budget, even with the additional appropriation, funds the schools at a level that does not meet their needs. The School Committee had to cut a number of items to balance the budget before sending it to the Board of Aldermen. Nor does it include funding for additional staff and technology to serve the increased number of students or updated curriculum materials to meet new state mandates. In short, there is no room in this budget to move our system forward.