
Inside the Budget, Part 2: Spending
In my last blog post, I explained the sources of revenue for the city budget. So naturally, the next question to address is how that money is spent.
Here’s a general breakdown of spending by department for the FY 2017 budget:
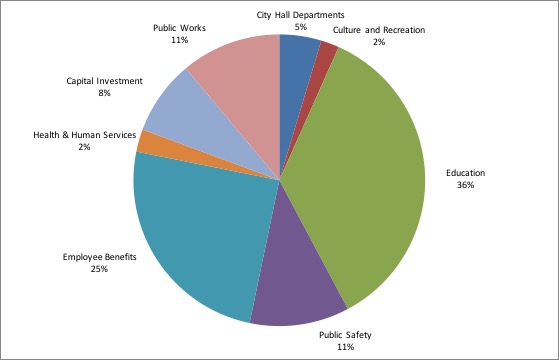
This first chart may look familiar, because we send out a copy with the tax bill every year. Here’s a bit more detail about what each “slice” includes:
City Hall Departments: Administrative offices, including the Assessor, Auditor, Board of Aldermen, City Clerk, City Solicitor, Elections, Human Resources, Inspectional Services, IT, Mayor’s Office, Planning, and Treasurer/Collector.
Culture and Recreation: Park Department, Recreation Department, Melrose Public Library, Memorial Hall
Education: The Melrose Public Schools, plus tuition paid to regional technical schools
Public Safety: Police, Fire, and Emergency Management
Employee Benefits: Health insurance, Workers’ Compensation, Unemployment Insurance, etc.
Health & Human Services: Health Department, Council on Aging
Capital Investment: Debt service for capital spending such as improvements to the Melrose High School Library
Public Works: All Public Works departments
The largest line item is public education, which is 36% of the budget.
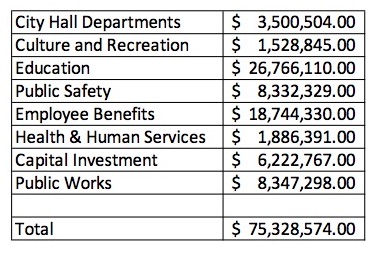
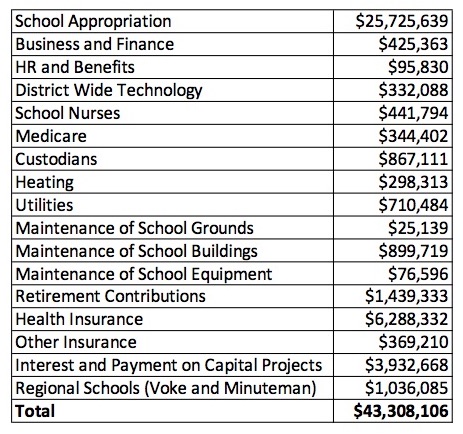
However, there is a much larger story to tell here: Actual spending on the schools is much higher, as the city side of the budget pays for other significant items, including
- Health insurance for school employees and retirees, as well as pension costs for non-teachers, liability insurance, unemployment, and workers’ compensation, which come from the Employee Benefits line;
- All maintenance of school buildings, equipment and grounds, heating and utilities, and custodians’ salaries, all of which are covered by Public Works;
- School nurses, who are paid from Health & Human Services.
Some of these items were moved out of the school budget over the past ten years in order to allow school administration and staff to concentrate their time, energy, and talents on providing education for our children rather than building and maintenance issues. I agree with this approach and have continued it in the current budget. It is a unique partnership in Melrose that has allowed city departments to reorganize themselves in order to support our public schools.
With that in mind, here’s a simpler breakdown of schools vs. all other city spending:
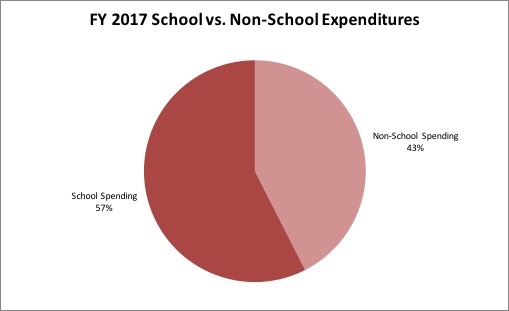
When everything is accounted for, nearly 60% of the operating budget goes to the schools. This does not include free cash or any other outside funding sources.
As you can see, our city budget prioritizes the schools. The good news is that this has created a more efficient system that frees up school staff to focus on school matters; the bad news is that because such a large share of city funds is dedicated to the schools, there is no room left for cuts to any city department without impacting direct services to residents. This is why we cannot continue our current level of services without more revenues.